고정 헤더 영역

상세 컨텐츠
본문
seaborn
1. seborn
1-1. 회귀선 그리기
import matplotlib.pyplot as plt
import seaborn as sns


sns.regplot(DF1.Height, DF1.Weight)
plt.show()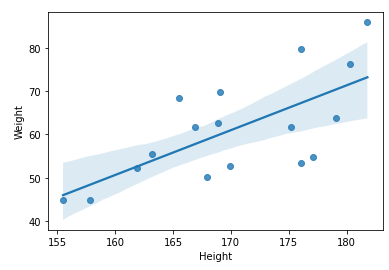
1-2. 선 그래프
sns.lineplot(DF1.index, DF1.Height)
plt.show()
1-3. 막대 그래프 - 연속형
sns.barplot(x = DF1.index, y = DF1.Height)
plt.show()
1-4. 막대 그래프 - 명목형
sns.countplot(DF1.BloodType)
plt.show()
1-5. 히스토그램
sns.distplot(DF1.Height)
plt.show()
1-6. 상자 그래프
sns.boxplot(y = DF1.Height, x = DF1.Grade)
plt.show()
1-7. 산점도
sns.scatterplot(DF1.Height, DF1.Weight, s = 50)
plt.show()
728x90
'데이터분석 > 시각화' 카테고리의 다른 글
| 데이터 분석 - 상관관계 히트맵 (0) | 2025.02.11 |
|---|---|
| 데이터 시각화 기초 - 그래프 종류 3 (0) | 2024.07.29 |
| 데이터 시각화 기초 - 그래프 종류 2 (3) | 2024.07.24 |
| 데이터 시각화 기초 - 그래프 종류 1 (0) | 2024.07.22 |
| 데이터 시각화 기초 - 그래프 그리기 (3) | 2024.07.15 |


