고정 헤더 영역

상세 컨텐츠
본문
서울 열린데이터 광장(https://data.seoul.go.kr/index.do)에서 데이터를 다운받아 서울시 인구들이 운동을 하지 않는 이유에 대해 유의미한 데이터를 알아보자
작업은 colab에서 진행
0. 한글폰트 설치 및 Excel패키지 업데이트
import matplotlib.font_manager as fm            #한글폰트 설치

# Linux
!apt-get -qq -y install fonts-nanum > /dev/null

# Colab
fontpath = '/usr/share/fonts/truetype/nanum/NanumBarunGothic.ttf'
font = fm.FontProperties(fname = fontpath, size = 10)
fm._rebuild()
import os
os.kill(os.getpid(), 9) #런타임 강제 종료 후 다시 시작한글 폰트 설치 적용을 위해 강제 종료 후 다시 시작 한다.
import matplotlib.pyplot as plt
import matplotlib as mpl
import matplotlib.font_manager as fm

mpl.rcParams['axes.unicode_minus'] = False

path = '/usr/share/fonts/truetype/nanum/NanumGothicBold.ttf'          #한글 폰트 설정
font_name = fm.FontProperties(fname = path, size = 10).get_name()
plt.rc('font', family = font_name)
fm._rebuild()
!pip install --upgrade xlrd #Excel 패키지 업데이트1. Data Preprocessing
1-1. xls 파일 읽어오기
import pandas as pd

DF = pd.read_excel('notExercise.xls')

DF.head()
1-2. 기간 열(colum) 삭제
DF.drop(columns = '기간', inplace = True)

DF.tail()
1-3. 23~52번(대분류) index 삭제
DF['대분류'][23:] #23~52 '대분류' 정보 확인
DF.drop(index = range(23, 53), inplace = True)  #23~52 행(Row) 삭제

DF
2. 성별 통계
2-1. 성별 데이터 추출
DF_G = DF[DF['대분류'] == '성별'].copy()

DF_G
2-2. 대분류 열(Column)삭제
DF_G.drop(columns = '대분류', inplace = True)

DF_G
2-3. 분류를 index로 지정
DF_G.set_index('분류', inplace = True)

DF_G
2-4. 시각화
import matplotlib.pyplot as plt

figure, ax = plt.subplots(2, 2, figsize = (10,10))


DF_G['운동을 할 충분한 시간이 없어서'].plot.pie(explode = [0, 0.02],
                                                ax = ax[0, 0],
                                                autopct = '%.1f%%')
ax[0, 0].set_title('운동을 할 충분한 시간이 없어서')
ax[0, 0].set_ylabel('')


DF_G['함께 운동을 할 사람이 없어서'].plot.pie(explode = [0, 0.02],
                                              ax = ax[0, 1],
                                              autopct = '%.1f%%')
ax[0, 1].set_title('함께 운동을 할 사람이 없어서')
ax[0, 1].set_ylabel('')


DF_G['운동을 할 만한 장소가 없어서'].plot.pie(explode = [0, 0.02],
                                              ax = ax[1, 0],
                                              autopct = '%.1f%%')
ax[1, 0].set_title('운동을 할 만한 장소가 없어서')
ax[1, 0].set_ylabel('')


DF_G['운동을 싫어해서'].plot.pie(explode = [0, 0.02],
                                 ax = ax[1, 1],
                                 autopct = '%.1f%%')
ax[1, 1].set_title('운동을 싫어해서')
ax[1, 1].set_ylabel('')

plt.show()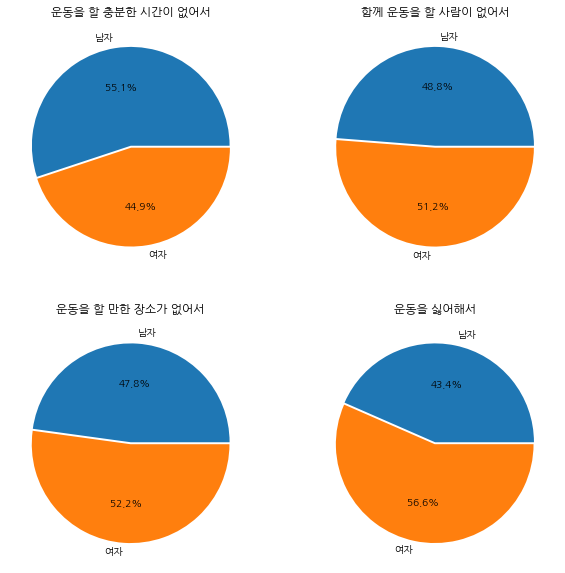
3. 연령별 통계
3-1. 연령별 데이터 추출
DF_A = DF[DF['대분류'] == '연령별'].copy()
DF_A.drop(columns = '대분류', inplace = True)
DF_A.set_index('분류', inplace = True)

DF_A
3-2. 시각화
import matplotlib.pyplot as plt

figure, ax = plt.subplots(1, 3, figsize = (16,8))

explode_set = [0.02, 0.02, 0.02, 0.02, 0.02, 0.02]

DF_A['운동을 할 충분한 시간이 없어서'].plot.pie(explode = explode_set,
                                                ax = ax[0],
                                                autopct = '%1.1f%%')
ax[0].set_title('운동을 할 충분한 시간이 없어서')
ax[0].set_ylabel('')


DF_A['함께 운동을 할 사람이 없어서'].plot.pie(explode = explode_set,
                                              ax = ax[1],
                                              autopct = '%1.1f%%')
ax[1].set_title('함께 운동을 할 사람이 없어서')
ax[1].set_ylabel('')


DF_A['운동을 할 만한 장소가 없어서'].plot.pie(explode = explode_set,
                                              ax = ax[2],
                                              autopct = '%1.1f%%')
ax[2].set_title('운동을 할 만한 장소가 없어서')
ax[2].set_ylabel('')

plt.show()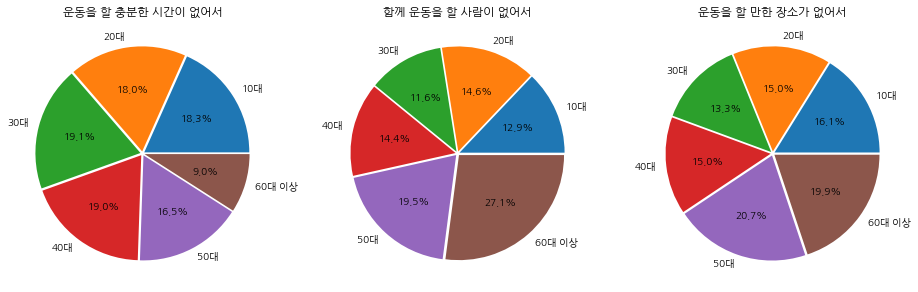
4. 학력별 통계
4-1. 학력별 데이터 추출
DF_V = DF[DF['대분류'] == '학력별'].copy()
DF_V.drop(columns = '대분류', inplace = True)
DF_V.set_index('분류', inplace = True)

DF_V
4-2. 시각화
import matplotlib.pyplot as plt

figure, ax = plt.subplots(1, 2, figsize = (16,8))

explode_set = [0.02, 0.02, 0.02, 0.02]


DF_V['운동을 할 충분한 시간이 없어서'].plot.pie(explode = explode_set,
                                                ax = ax[0],
                                                autopct = '%.1f%%')
ax[0].set_title('운동을 할 충분한 시간이 없어서')
ax[0].set_ylabel('')


DF_V['운동을 싫어해서'].plot.pie(explode = explode_set,
                                 ax = ax[1],
                                 autopct = '%.1f%%')
ax[1].set_title('운동을 싫어해서')
ax[1].set_ylabel('')

plt.show()
728x90
'데이터분석 > 실습' 카테고리의 다른 글
| 서울시 CCTV 현황 분석 (0) | 2022.05.31 |
|---|---|
| 대중교통 데이터 시각화 하기 2 (0) | 2022.04.26 |
| 대중교통 데이터 시각화 하기 1 (0) | 2022.04.26 |
| 우리 동네 인구 구조 시각화 하기 (0) | 2022.04.26 |
| 기온 공공 데이터 활용 데이터 분석하기 (0) | 2022.04.26 |


