고정 헤더 영역

상세 컨텐츠
본문
MobileNetV2를 활용한 ImageNet 분류
1. Tensorflow Hub
import tensorflow
import numpy as np
import tensorflow_hub as hub

url = 'https://tfhub.dev/google/tf2-preview/mobilenet_v2/classification/2'

#사전 훈련된 MobileNetV2
MbNetV2 = tensorflow.keras.Sequential([hub.KerasLayer(handle = url,
                                                      input_shape = (224, 224, 3),
                                                      trainable = False)])
MbNetV2.summary()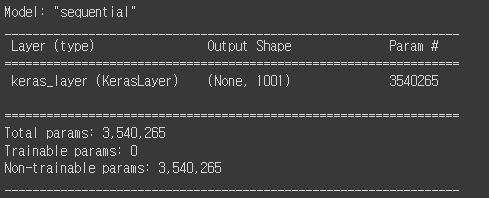
from tensorflow.keras import utils

utils.plot_model(MbNetV2,
                 show_shapes = True,
                 show_dtype = True)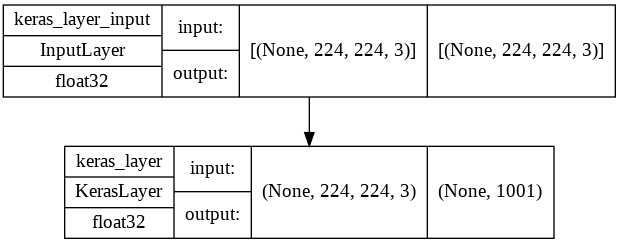
2. ImageNetV2 TopImages
2-1. 이미지(ImageNetV2) 다운로드
%%time

import os

image_url = 'https://s3-us-west-2.amazonaws.com/imagenetv2public/imagenetv2-top-images.tar.gz'
data_dir = '/content/'

data_root_orig = tensorflow.keras.utils.get_file('imagenetV2',
                                                 image_url,
                                                 cache_dir = data_dir,
                                                 extract = True)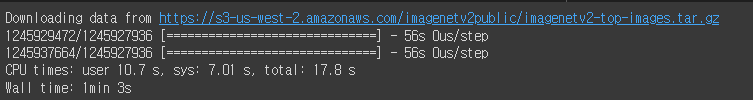
!ls /content/datasets/imagenetv2-top-images-format-val
2-2. Image Label 다운로드
import pandas as pd

url = 'https://storage.googleapis.com/download.tensorflow.org/data/ImageNetLabels.txt'
DF = pd.read_table(url, header = None)

label_text = DF.values.reshape(-1)
print(len(label_text))
print(label_text[:5])
print(label_text[-5:])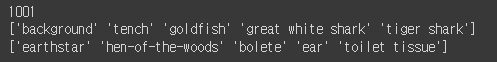
2-3. Image(X) vs. Label(y) 확인
import random

all_image_paths = list(data_root.glob('*/*'))
all_image_paths = [str(path) for path in all_image_paths]

random.choice(all_image_paths)
import PIL.Image as Image
import matplotlib.pyplot as plt
random.shuffle(all_image_paths)
image_count = len(all_image_paths)
print('image_count:', image_count)
plt.figure(figsize = (12, 12))
for n in range(9):
image_path = random.choice(all_image_paths)
plt.subplot(3, 3 , n + 1)
plt.imshow(plt.imread(image_path))
idx = int(image_path.split('/')[-2]) + 1
plt.title(str(idx) + ' : ' + label_text[idx])
plt.axis('off')
plt.show()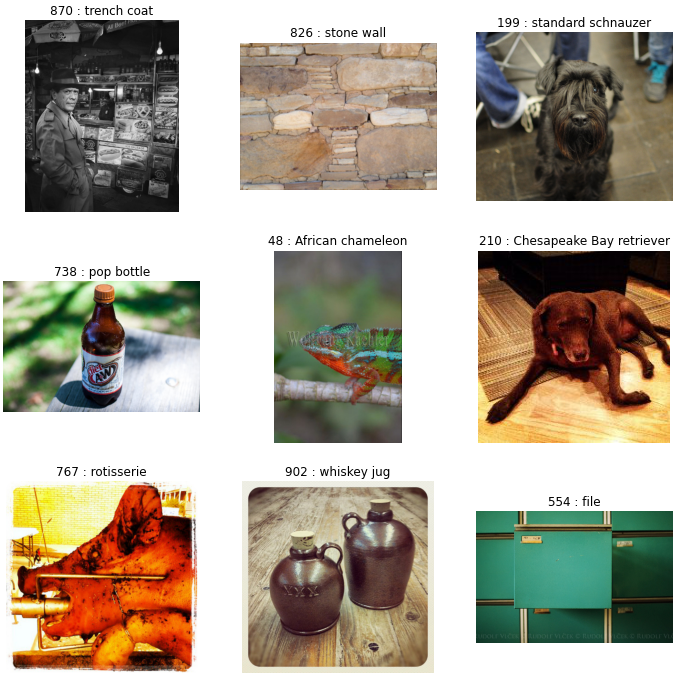
3. MobileNet의 분류 라벨 확인
import cv2

plt.figure(figsize = (16, 16))

def softmax(x):
    m = np.max(x)
    sm = np.exp(x - m)/np.sum(np.exp(x - m))
    return sm

for n in range(3):
    # 랜던 이미지 경로 추출
    image_path = random.choice(all_image_paths)

    # 이미지 출력
    plt.subplot(3, 2, n * 2 + 1)
    plt.imshow(plt.imread(image_path))
    idx = int(image_path.split('/')[-2]) + 1
    plt.title(str(idx) + ' : ' + label_text[idx])
    plt.axis('off')

    # Top-5 예측값 출력 공간
    plt.subplot(3, 2 , n * 2 + 2)

    # 이미지 크기 변경 및 정규화
    img = cv2.imread(image_path)
    img = cv2.resize(img, dsize = (224, 224))
    img = img / 255.0
    img = np.expand_dims(img, axis = 0)

    # MobileNetV2 이미지 분류
    logits = MbNetV2.predict(img)[0]
    prediction = softmax(logits)

    # Top-5 예측값
    top_5_predict = prediction.argsort()[::-1][:5]
    labels = [label_text[index] for index in top_5_predict]

    # Top-5 막대그래프 색상 지정
    color = ['gray'] * 5
    if idx in top_5_predict:
        color[top_5_predict.tolist().index(idx)] = 'green'
    color = color[::-1]

    # Top-5 막대그래프 출력
    plt.barh(range(5), prediction[top_5_predict][::-1] * 100, color = color)
    plt.yticks(range(5), labels[::-1])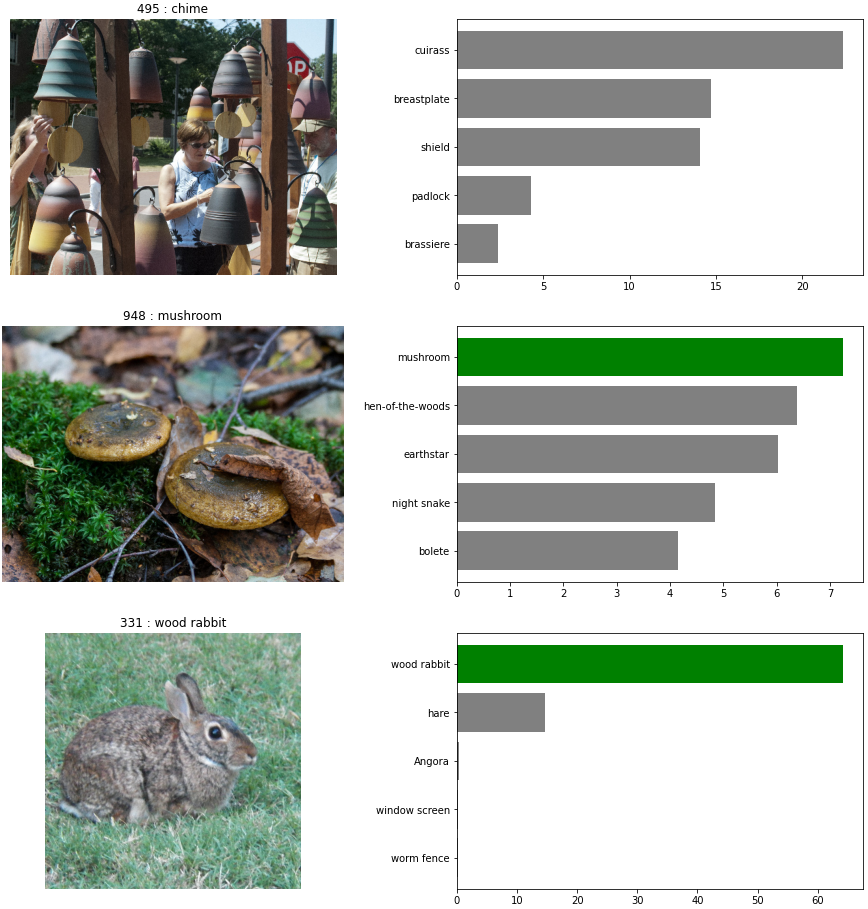
AR = np.array([5555, 55, 5, 555])
print('오름차순 정렬 :', np.sort(AR), '\n')

arg = np.argsort(AR)
print('오름차순 정렬 후 Index :', arg, '\n')

print('argsort 결과 적용 :', AR[arg])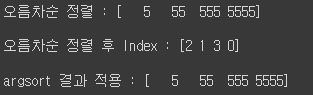
4. MobileNetV2의 분류 성능 확인
%%time

import cv2

top_1 = 0
top_5 = 0

for image_path in all_image_paths:
    img = cv2.imread(image_path)
    img = cv2.resize(img, dsize = (224, 224))
    img = img / 255.0
    img = np.expand_dims(img, axis = 0)

    top_5_predict = MbNetV2.predict(img)[0].argsort()[::-1][:5]
    idx = int(image_path.split('/')[-2]) + 1

    if idx in top_5_predict:
        top_5 =  top_5 + 1
        if top_5_predict[0] == idx:
            top_1 = top_1 + 1

print('Top-5 Correctness:', top_5 / len(all_image_paths) * 100, '%')
print('Top-1 Correctness:', top_1 / len(all_image_paths) * 100, '%')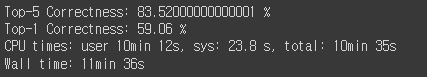
728x90
'인공지능 > 딥러닝' 카테고리의 다른 글
| YOLOv3 Object Detection 2 (0) | 2022.07.04 |
|---|---|
| YOLOv3 Object Detection 1 (0) | 2022.07.04 |
| CNN(Convolutional Neural Network)-CIFAR 100_ResNet50V2 (0) | 2022.07.04 |
| CNN(Convolutional Neural Network)-CIFAR 10_Functional API Modeling (0) | 2022.06.29 |
| CNN 모델 학습 시각화 (0) | 2022.06.28 |


